Updated: 2025 — Analysis with ATTOM, ICE Mortgage Monitor, and industry data
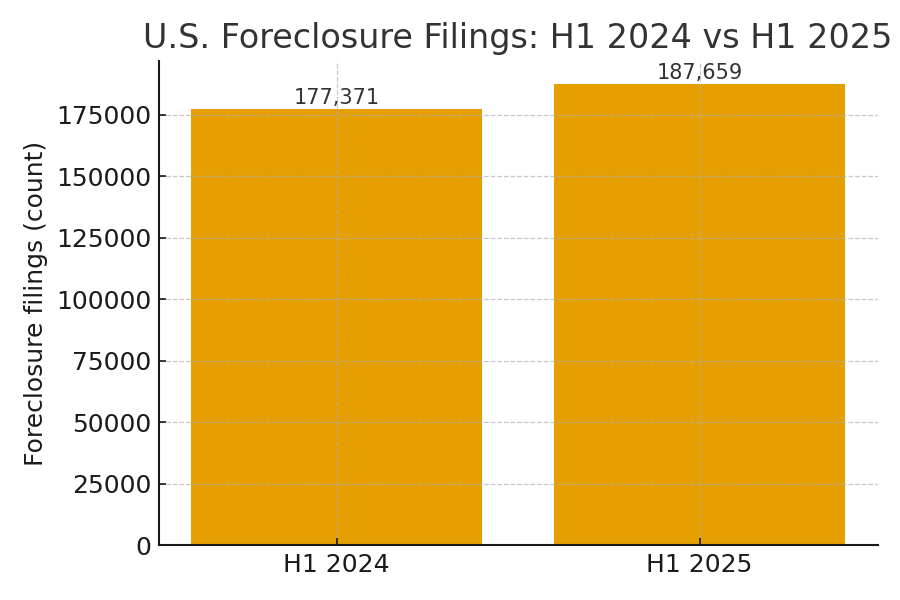
U.S. foreclosure filings: H1 2024 vs H1 2025 (source: ATTOM Mid-Year 2025 report).
Executive summary
Foreclosure activity in the U.S. rose in 2025 compared with the prior year, reversing several years of depressed foreclosure inventories following the pandemic-era policy interventions. In the first half of 2025 there were 187,659 properties with foreclosure filings (default notices, scheduled auctions, or bank repossessions), an increase of roughly 5.8% year-over-year.
Key 2025 figures you should know
- H1 2025 total foreclosure filings: 187,659 (up 5.8% vs H1 2024).
- Q2 2025 filings: 100,687 properties had a foreclosure filing in Q2 2025 (Q2 showed both the highest quarterly volumes and the fastest increases in some regions).
- Monthly/quarter spikes: Several months in 2025 registered sharp upticks in foreclosure starts and lender completions compared with the prior year — a pattern noted across multiple industry trackers. See ICE Mortgage Monitor for loan performance (delinquency) trends.
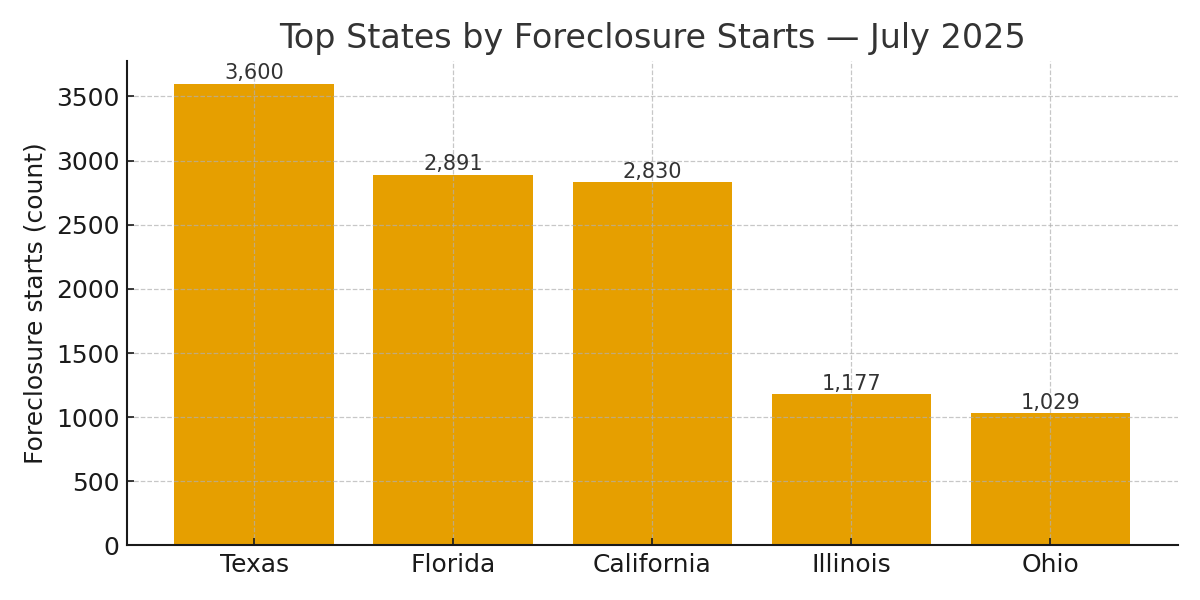
- July 2025 foreclosure starts (sample): lenders started the foreclosure process on ~24,302 properties in July 2025, with the largest counts in Texas, Florida and California (Texas 3,600; Florida 2,891; California 2,830).
Why foreclosures are rising in 2025
The upsurge in 2025 reflects several converging forces:
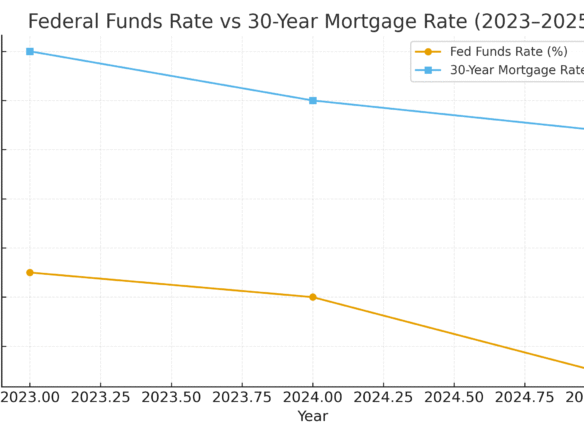
- Higher borrowing costs and payment stress: Mortgage rates remained elevated versus the ultra-low rates of 2020–2021, increasing carrying costs for adjustable-rate borrowers and recent buyers who financed at higher rates. This raises the chance of missed payments and eventual foreclosure starts.
- Exhaustion of pandemic-era forbearance and relief programs: Many forbearance programs ended in prior years; households that relied on temporary relief are now vulnerable if incomes or savings are insufficient.
- Regional economic stress: Local job-market shocks, sectoral declines or localized housing supply issues are concentrating foreclosure risk in certain states and metro areas. ATTOM and other trackers show some states with much shorter foreclosure timelines and higher per-unit rates.
Where the problem is worst — state and metro hotspots
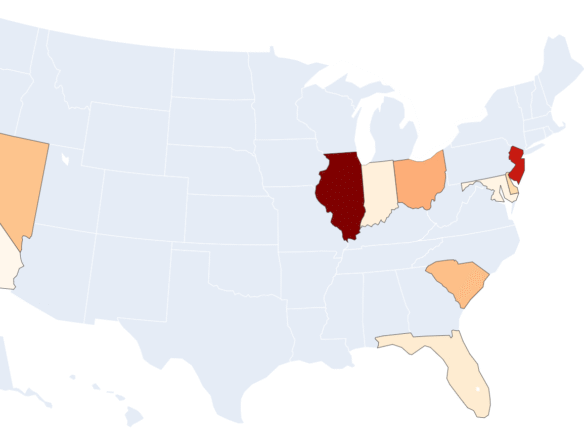
Foreclosure increases are not evenly distributed. July and Q2 2025 data show the highest activity concentrated in Sun Belt and Midwestern states, with particular pressure in Texas, Florida, California, Illinois and Ohio (by monthly starts count). ATTOM’s county-level reports identify additional high-risk pockets (including parts of Louisiana, South Carolina and Nevada) with elevated underwater rates and faster foreclosure timelines.

What this means for different audiences
Homeowners
If you’re behind on mortgage payments: contact your lender or a housing counselor immediately. Forbearance and modification programs still exist in some places; timelines and eligibility vary by program and state. National data show rising delinquencies are an early warning — acting early preserves options.
Investors and house-flippers
Opportunities may grow — more repossessed properties and auction inventory typically follow rising foreclosure starts and completions. Yet buyer competition, repair costs, local market health, and legal timelines vary by state — research county-level records and property condition carefully. ATTOM’s mid-year data can help spot counties where filing activity is increasing fastest.
Policymakers and servicers
The 2025 trends underscore the need for targeted assistance in high-risk areas (rental assistance, homeowner counseling, and local workforce support), and improved loss mitigation to prevent avoidable dispossessions. Loan servicers should continue robust outreach where delinquencies rise.
Forecast and what to watch in the rest of 2025
Short-term: expect further monthly volatility. Several trackers reported sequential monthly increases through mid-2025 — a trend to follow closely. Longer-term risk will depend on job growth, consumer savings, and whether mortgage rates stabilize or fall. If the economy weakens or unemployment rises, foreclosure volumes could accelerate; conversely, stronger labor markets could blunt the trend.
Data sources & methodology
This analysis synthesizes loan-level performance and public filing data from national data providers and industry reports (ATTOM, ICE Mortgage Monitor, and related reporting). Figures cited are taken from the primary industry releases and monthly monitoring reports. See the source list below for the original reports and press releases.
Sources
- ATTOM — Mid-Year 2025 U.S. Foreclosure Market Report (H1 2025 totals and YoY change).
- ATTOM / PR Newswire — Q2 2025 and July 2025 foreclosure breakdowns (Q2 filng counts and states).
- ICE Mortgage Monitor — May 2025 mortgage performance & delinquency trends (loan-level monitoring).
- HousingWire / industry coverage — month-to-month trend summaries and state breakdowns.
Data in this article represent national- and state-level filings reported by data vendors and reflect reporting cycles; local conditions can differ. This article is for informational purposes and not legal advice.

Join The Discussion