Introduction
As the U.S. housing market cools from its pandemic highs, foreclosure filings are climbing in specific regions. While the national foreclosure rate remains below 2008 levels, several states are flashing early warning signs.
According to ATTOM’s Q2 2025 report, there were 237,000 foreclosure filings nationwide, up 23% year-over-year — the sharpest rise in five years.
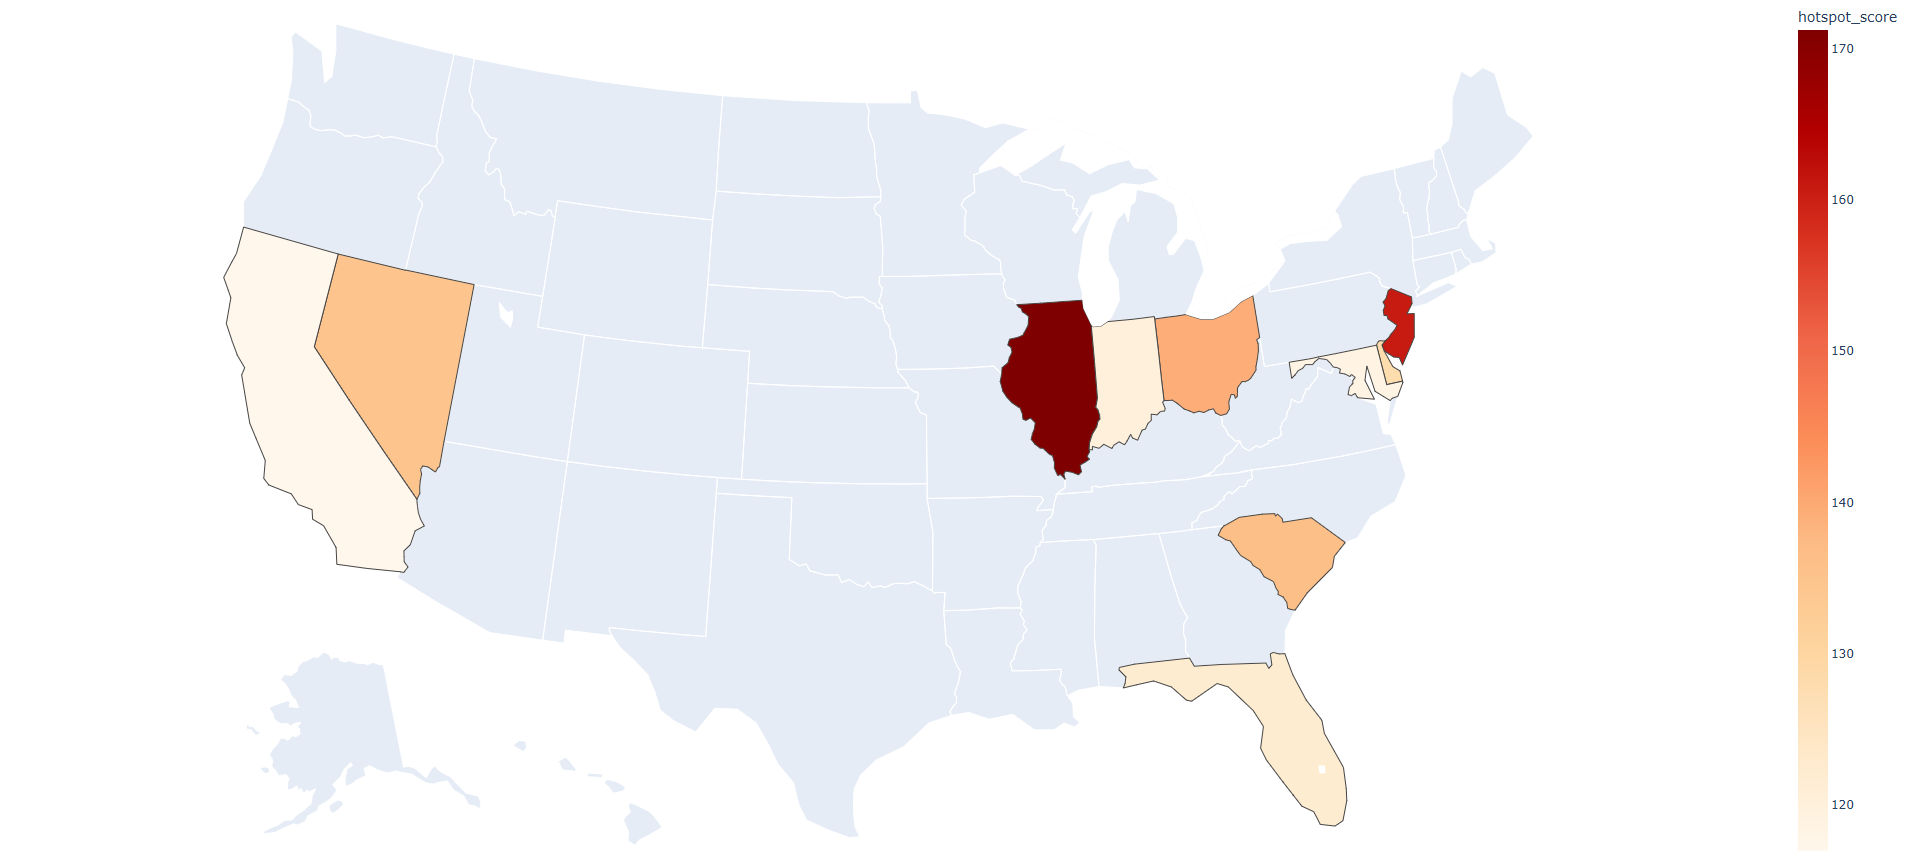
U.S. Foreclosure Hotspots 2025.
Top 10 States with the Most Foreclosures (2025)
| Rank | State | Foreclosure Rate (1 in X homes) | % Change YoY | Main Drivers |
|---|---|---|---|---|
| 1 | Illinois | 1 in 584 | +27% | Job loss, aging inventory |
| 2 | New Jersey | 1 in 622 | +31% | Legacy distress, high costs |
| 3 | Ohio | 1 in 718 | +24% | Declining affordability |
| 4 | South Carolina | 1 in 734 | +22% | Overleveraged homeowners |
| 5 | Nevada | 1 in 741 | +28% | Speculative buying, resets |
| 6 | Delaware | 1 in 782 | +19% | Economic stagnation |
| 7 | Florida | 1 in 819 | +18% | Hurricane impact + high insurance |
| 8 | Indiana | 1 in 832 | +15% | Wage stagnation |
| 9 | Maryland | 1 in 844 | +13% | Tax lien foreclosures |
| 10 | California | 1 in 855 | +21% | Rate shock, price correction |
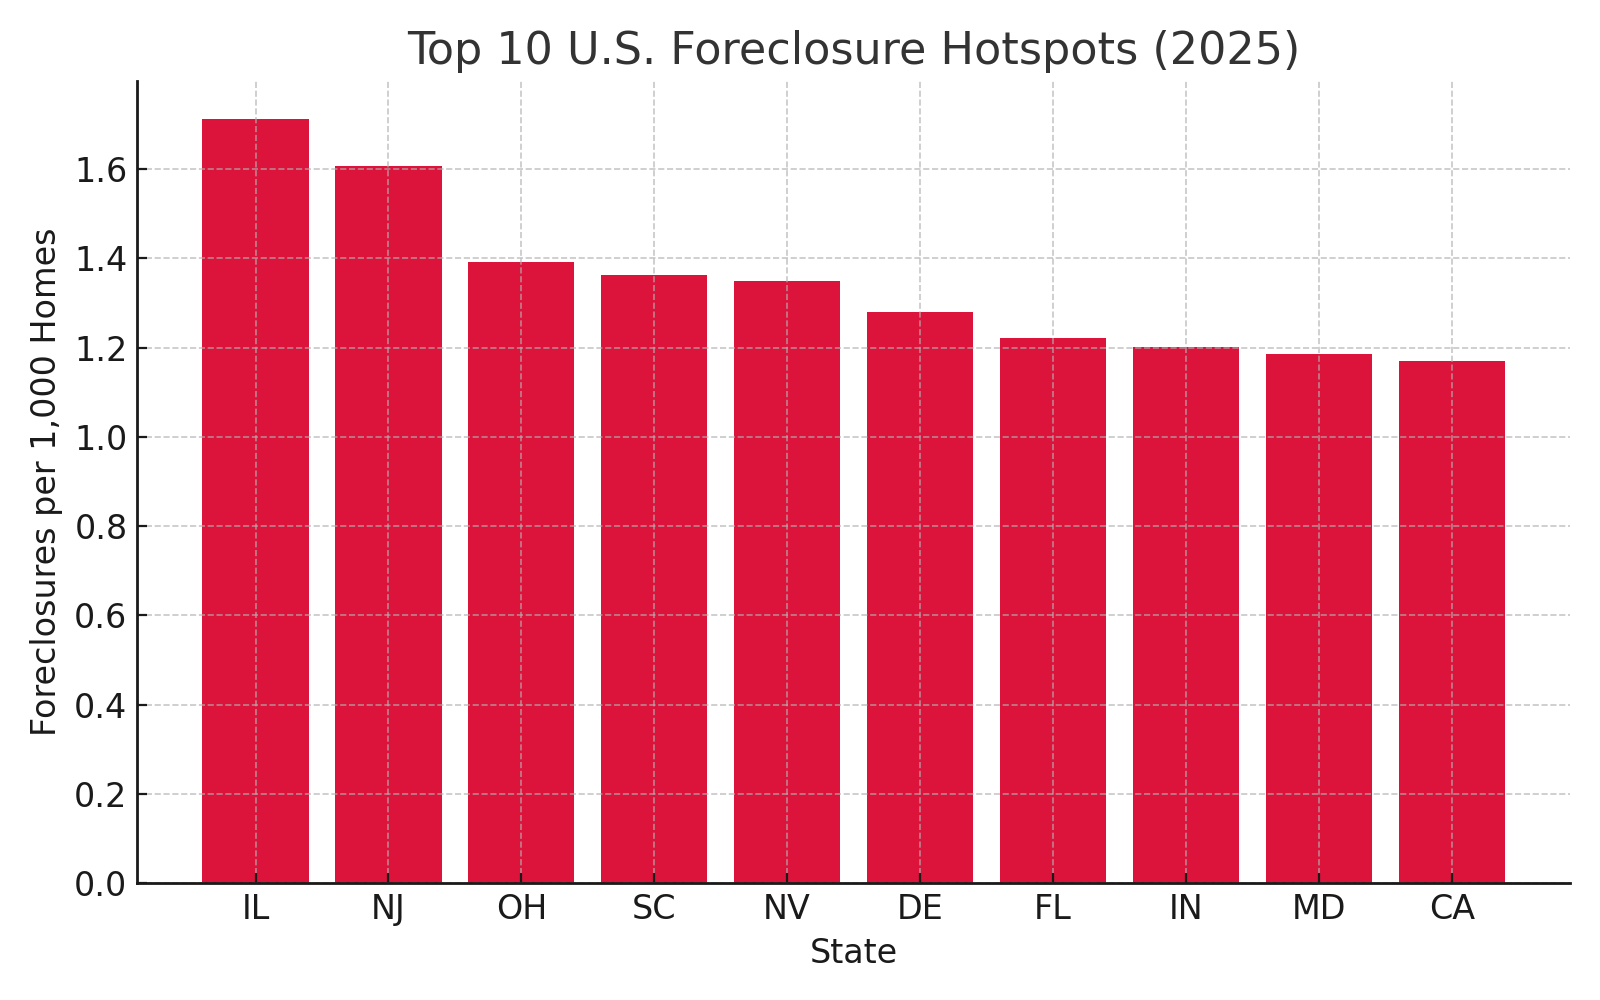
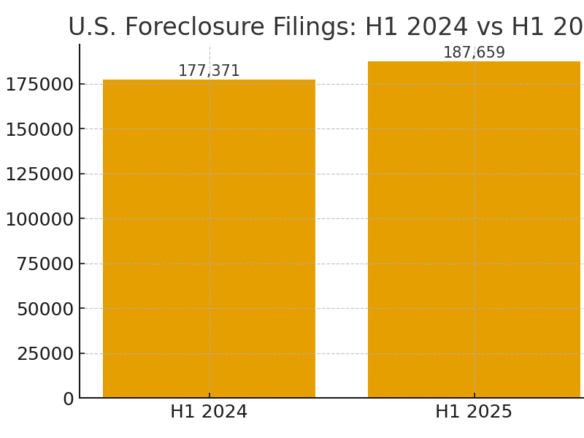
Top 10 Foreclosure States, 2024 vs 2025
What These Numbers Really Mean
While rising foreclosure filings may sound alarming, context matters.
- Most homeowners still have record-high equity.
- Serious delinquencies remain below 2%.
- Unemployment (at 4.1%) is far below 2008 levels.
In other words, this is a normalization, not a collapse.
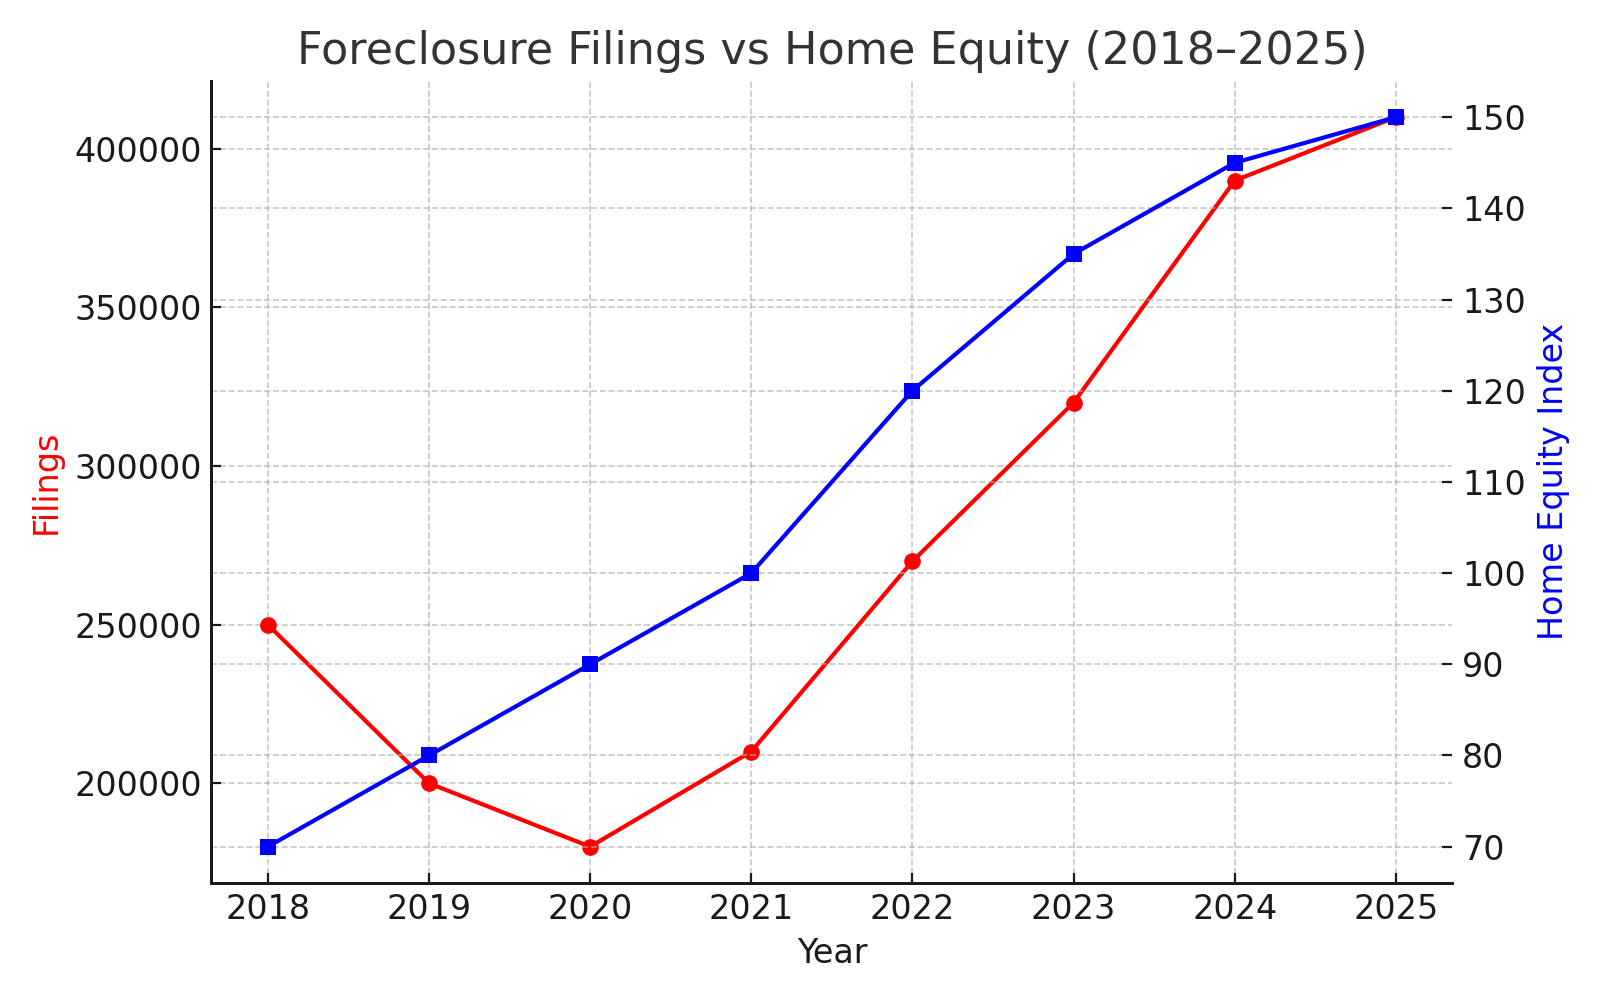
Foreclosure Filings vs Home Equity (2018–2025)
Outlook for 2026
Foreclosure rates may continue rising modestly as more adjustable-rate loans reset and pandemic-era savings dwindle. However, analysts expect stability by mid-2026 as home prices adjust and wage growth strengthens.
Sources
- ATTOM Data Solutions Foreclosure Report (June 2025)
- Black Knight Mortgage Performance Dashboard (2025)
- CoreLogic Market Trends (Q2 2025)
- Bureau of Labor Statistics (2025 Employment Data)

Join The Discussion